Performance Dashboard
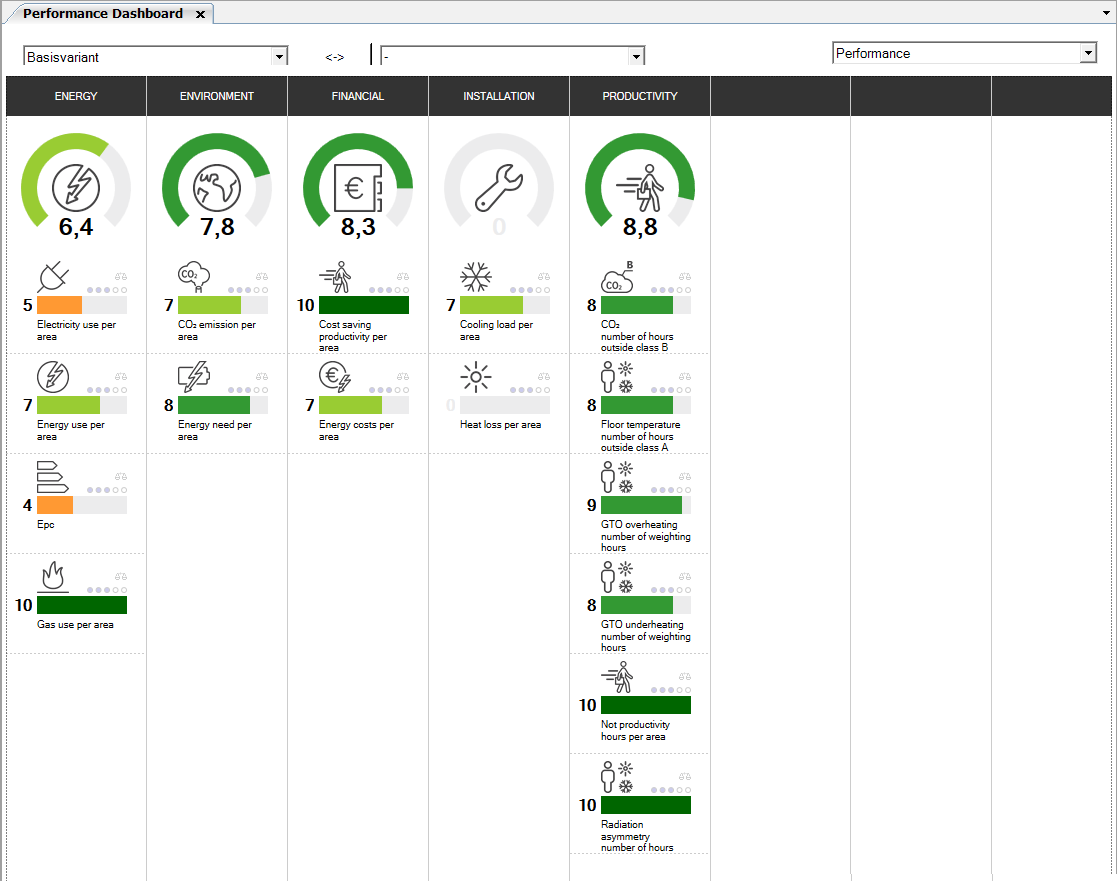
The following themes, also known as Critical Performance Indicators (KPI’s), are displayed in the columns. KPI’s are made up out of multiple PI’s these are beneath each other in the columns.
Performance
Variants
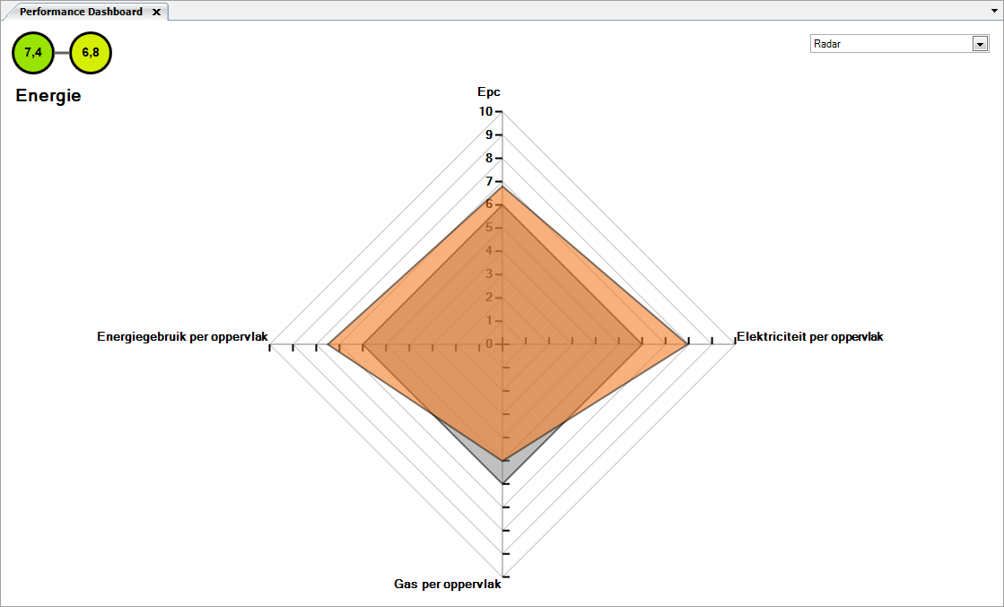
With the help of varieties, performances can be compared. The grey values are for the first variety and the coloured for the second. With the button in the middle, you can switch the two.
Visibility
With this function you can hide columns or PI’s.
Save image
You can make an image out of the dashboard.
Display KPI
Here the grade of the PI is visible. Every PI has its own icon. Even the weighting of the PI can be set in regard to the KPI. When the PI is selected, a 3D window opens with a visualization of the PI.
Weight
There are 3 dark grey dots with which you can adjust the weight of the PI. 1 dot is a light weight and 5 is the heaviest weight.
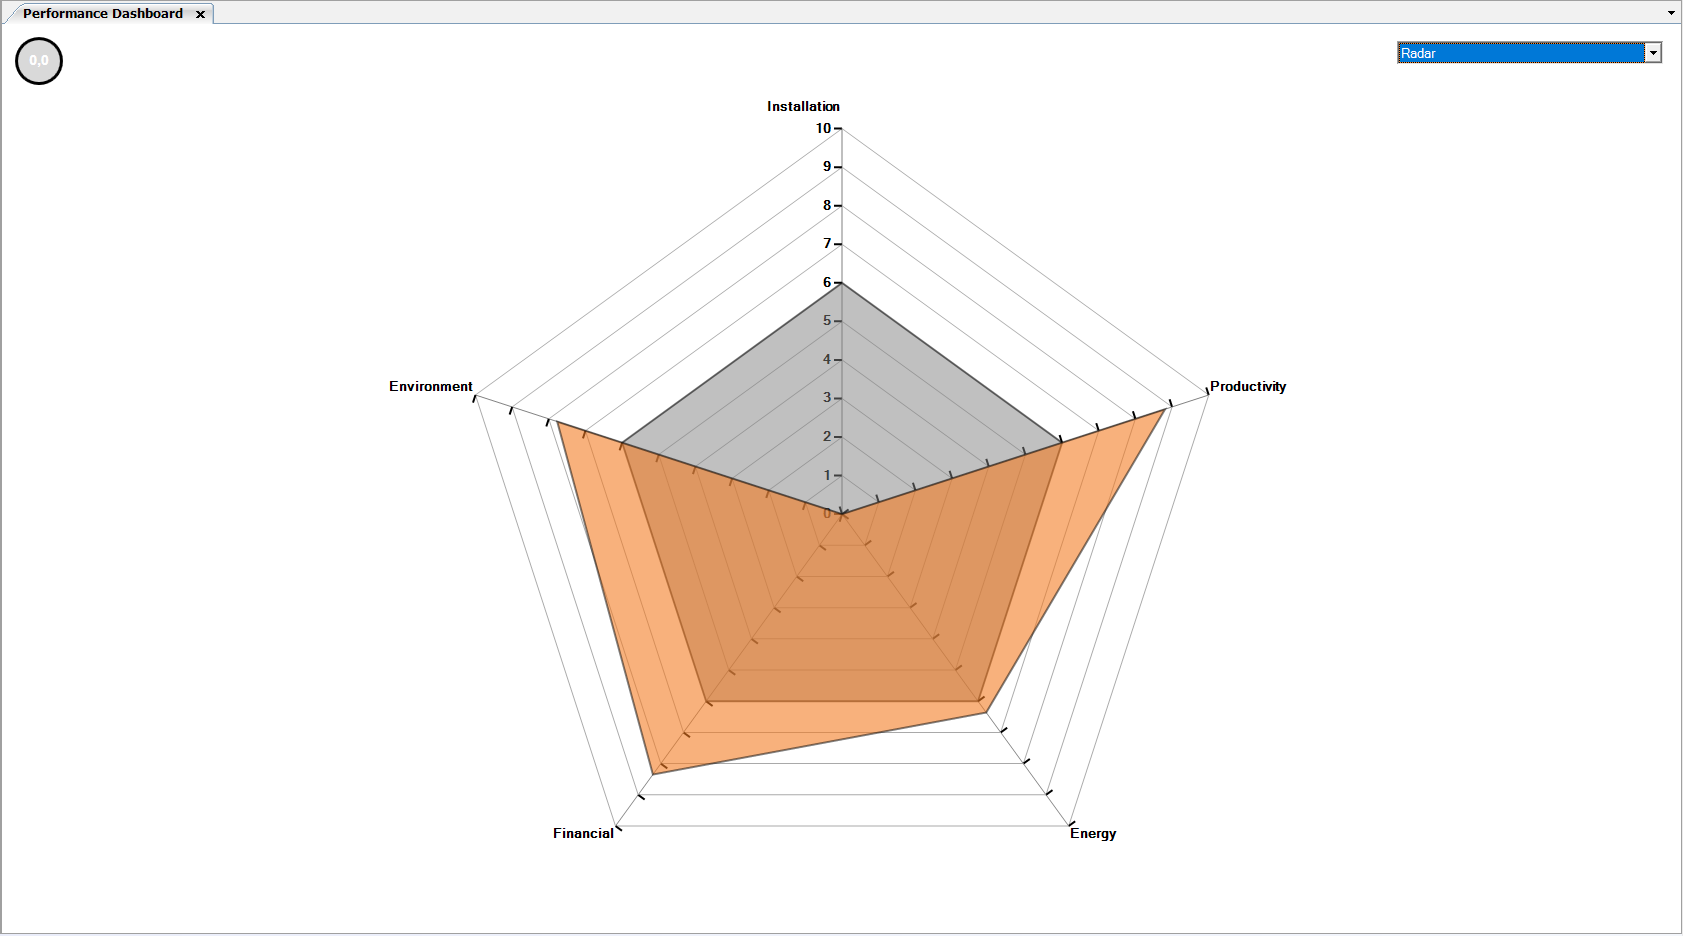
Radar
In the top right corner, you can select for overview Radar. It displays the different variants in one visual compared to the norm.
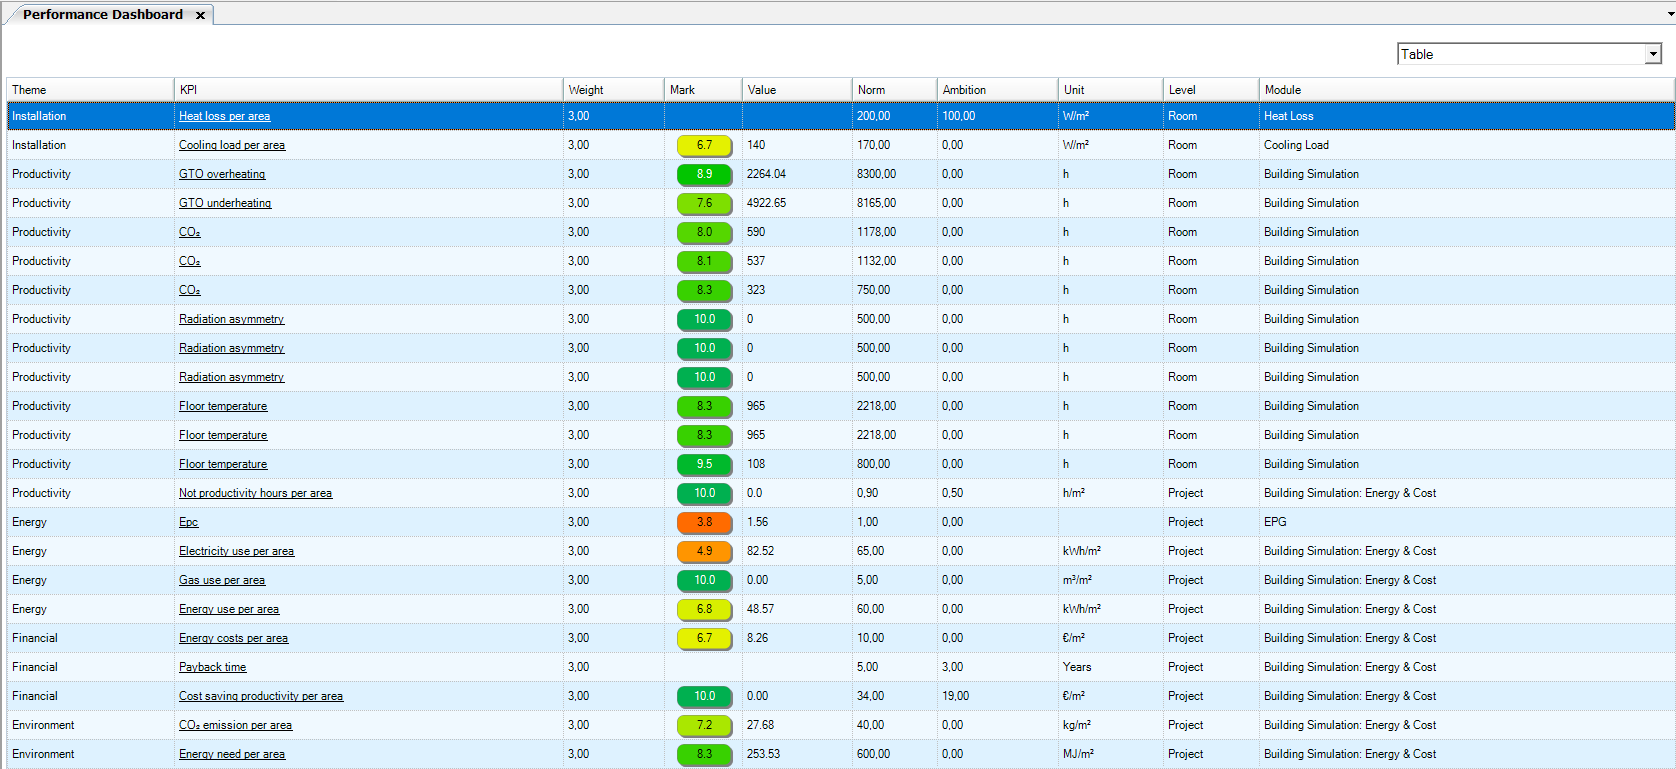
Table
The other option in the top right corner, is table. In this table overview of all the PI in one list. It gives a detailed summary and with feedback per individual PI score. The cells in the column Weight, Norm and Ambition are adjustable.