Cooling load
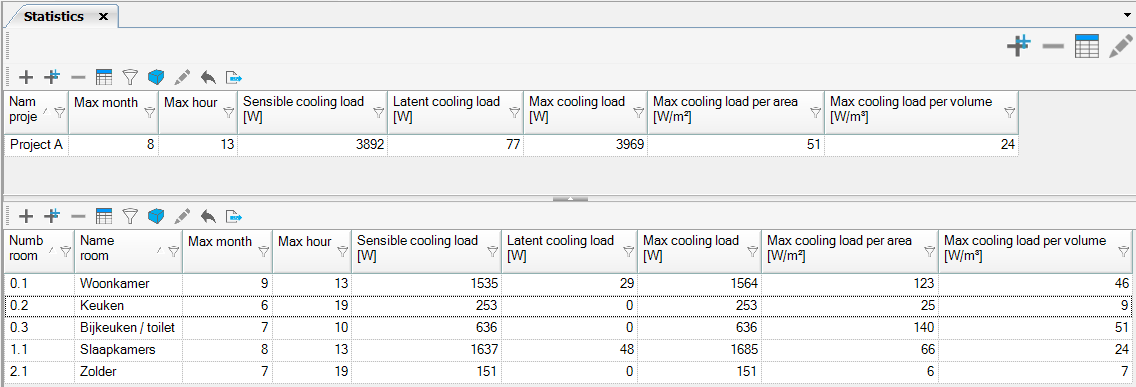
Statistics
In the statistics, you will find a comprehensive overview and a per room breakdown of the various subcategories for Cooling load.
Maximum Cooling Load: Difference Between Building and Rooms
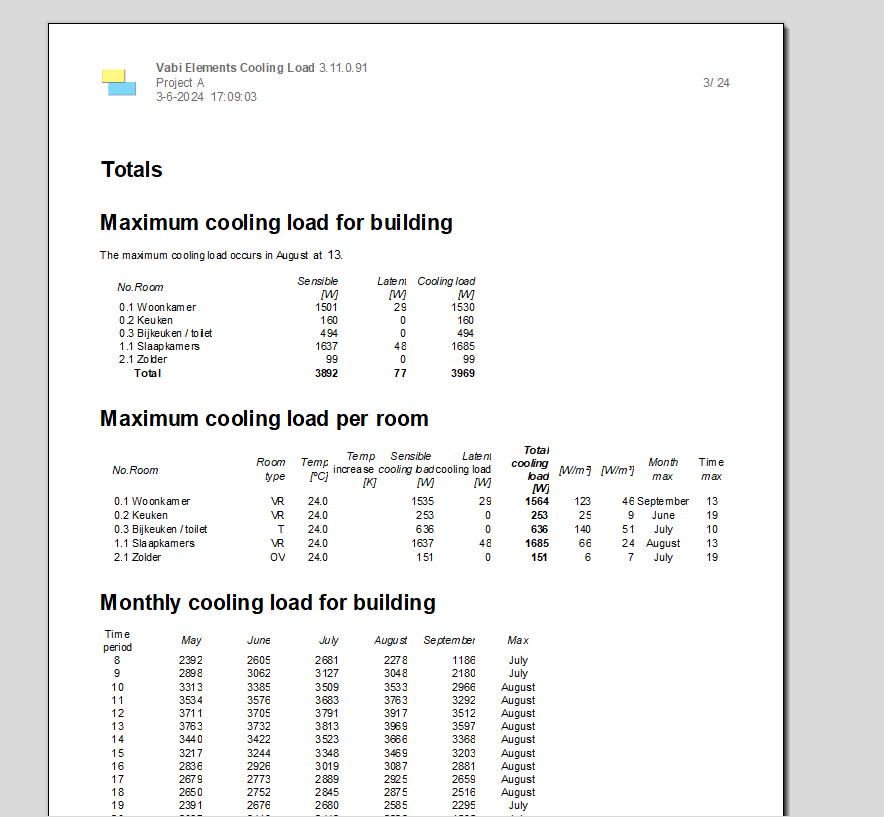
The maximum cooling load of a building is not simply the sum of the peak cooling loads of the individual rooms. This is because the peak cooling load for each room occurs at different times. The image below illustrates this principle. It shows that the peak cooling loads of the rooms occur at different times, resulting in the sum of the peak cooling loads of the rooms being higher than the building’s peak cooling load (4289 W compared to 3969 W).

Report
In the Word report you can find the all the results and assumption. Easily navigate through the report with the menu on the left. At the top, there’s a toolbar that allows you to choose various display options.
You can print this report and export it to Word.
The Text (TXT) report includes the same components as the Word report. You can print and export this report as a PDF.