General
Under the General menu, you will find some general results. We distinguish three types of results here: 3D visualizations, charts, and tables.
3D visualisations
The following 3D visualizations are available:
- Use template per room
- Ventilation template per room
- AHU template per room
- Architectural template per room
- Room requirements template per room
- Generation
- Distribution
- Air handling
Graphs
The following general charts can be displayed:
- Area ratio of opaque/transparent
- Area ratio per construction type
- Gross/net usage area
The charts display a 3D bar diagram of various input data.
- You can rotate the bar diagram using the middle mouse button.
- You can zoom in and out of the chart using the scroll wheel.
- You can reset the chart to its original position by double-clicking the left mouse button.
- You can save the chart by right-clicking and selecting an EMF, JPG, BMP, or PNG file format.
If you want to save a chart, right-click on the chart you wish to export. Click on Save Chart. A Windows Explorer window will appear where you can specify the location to save the EMF, JPG, BMP, or PNG image.
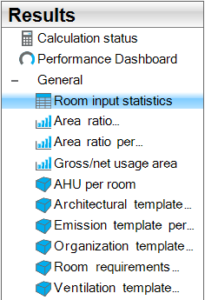
Tables
Under General, the Room Input statistics table is available. This table contains the basic input data from the project in several columns.