Building simulation Energy & Costs
Tabels
There are two tables for the module Building simulation Energy and Costs available.
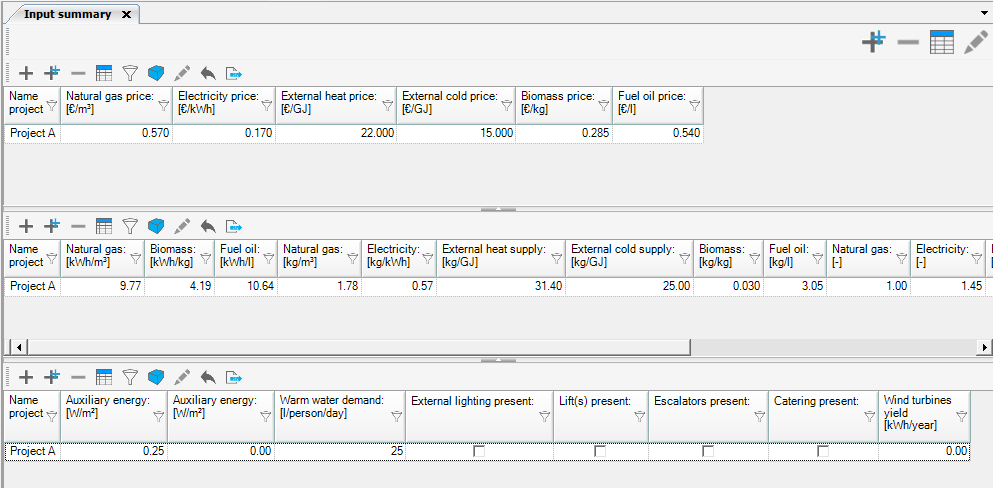
- Input summary: In these graphs you can find the input for Energy prices, combustion values, Auxiliary energy, unregulated energy usage, and Wind turbines.
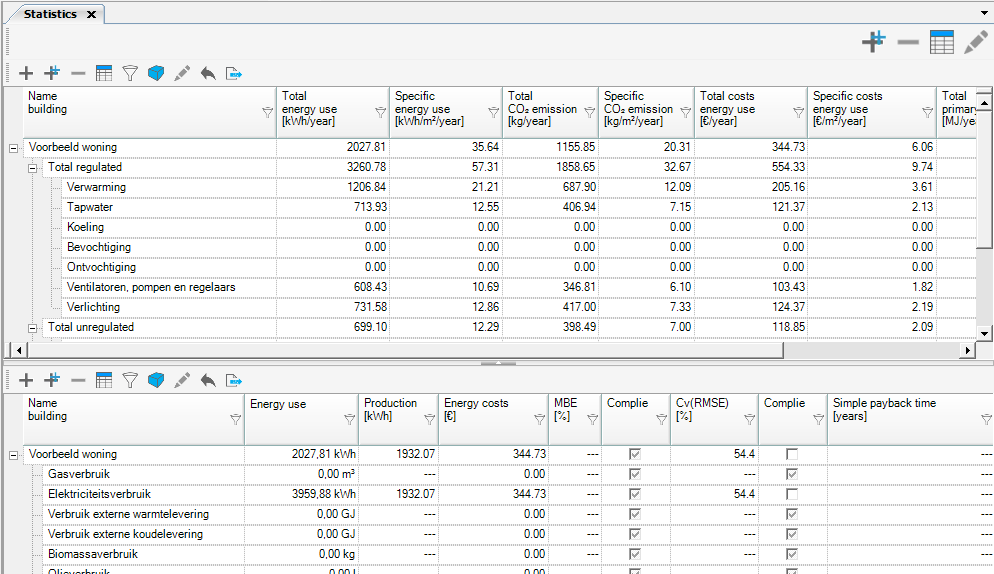
- Statistics: this graph gives an overview of the3 results of the year graph in table shape, some overal results, the results or the optional calibration, and the result of the Simple payback time. It also contains the non-productive hours and the costs in comparison to the productivity losses for an office function.
Graphs
For the model Building Simulation Energy and Costs the following graphs are available
- Simple payback time: When by comparison under the settings Simple payback time is selected a graph will be available here;
- Month graph: Multiple results per type of usage made insightful per month. The graph can be adjusted to be arranged per energy carrier. In comparison to the Year charts, the month chart is calibrated per month, when Calibration is chosen under Settings;
- Year chart (bar): multiple results per type of usage made insightful. The graph can be adjusted to be arranged per energy carrier;
- Year chart (pie): multiple results per type of usage made insightful. The graph can be adjusted to be arranged per energy carrier.
Usage type
Ventilators, pumps and regulators
Ventilators, pumps and regulators contains the consumption of the ventilators and the auxiliary energy of the pumps and regulators.
The usage of the ventilators is calculated based on the air flow that has been entered in warming up (Resources, Air handling). This gives you the electric power.
The auxiliary energy for the pumps and regulators is calculated out of the entered values in Project data: Heat and Cold. These are used when the installation is running. When heating is on, then the auxiliary energy of the heat emitter is on as well. The usage of the circulation pump of Project Data Domestic Hot Water is incorporated.